Category:Demographics of London
Jump to navigation
Jump to search
demographics of region | |||||
| Upload media | |||||
| Instance of |
| ||||
|---|---|---|---|---|---|
| Subclass of | |||||
| Location | London, Greater London, London, England | ||||
| |||||
Subcategories
This category has the following 2 subcategories, out of 2 total.
E
M
Media in category "Demographics of London"
The following 136 files are in this category, out of 136 total.
-
 15 to 64 year olds (working age population) in London.svg 512 × 411; 325 KB
-
 1901 Foreign born in London.svg 512 × 392; 152 KB
-
 1911 Foreign born in London.svg 512 × 392; 151 KB
-
 1921 Foreign born in London.svg 512 × 392; 151 KB
-
 1931 Foreign born in London.svg 512 × 392; 151 KB
-
 1951 Foreign born in London.svg 512 × 392; 152 KB
-
 1991 Asian percentage London.svg 512 × 411; 103 KB
-
 1991 Black percentage London.svg 512 × 411; 103 KB
-
 1991 White percentage London.svg 512 × 411; 102 KB
-
 2001 Asian percentage in London.svg 512 × 411; 103 KB
-
 2001 Black percentage in London.svg 512 × 411; 103 KB
-
 2001 White percentage London.svg 512 × 411; 102 KB
-
 2011 Asian percentage in London.svg 512 × 411; 102 KB
-
 2011 Black percentage in London.svg 512 × 411; 103 KB
-
 2011 White percentage London.svg 512 × 411; 103 KB
-
 2021 White British percentage in London.svg 512 × 411; 47 KB
-
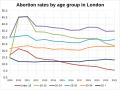 Abortion rates by age group in London.svg 2,098 × 1,563; 14 KB
-
 Age standardised suicide rates in London.svg 2,414 × 1,638; 13 KB
-
 Asian births in London in 2021.svg 512 × 411; 46 KB
-
 Asian percentage 2021 London.svg 512 × 411; 102 KB
-
 Barking and Dagenham population pyramid.svg 2,743 × 2,163; 29 KB
-
 Barnet population pyramid.svg 2,743 × 2,163; 28 KB
-
 Bexley population pyramid.svg 2,743 × 2,163; 29 KB
-
 Black births in London in 2021.svg 512 × 411; 65 KB
-
 Black percentage 2021 London.svg 512 × 411; 103 KB
-
 Born to foreign born mothers - 2007 in London.svg 512 × 411; 102 KB
-
 Born to foreign born mothers - 2014 in London.svg 512 × 411; 300 KB
-
 Born to foreign born mothers - 2021 in London.svg 512 × 411; 102 KB
-
 Boroughs of London Romanian.svg 512 × 410; 1.15 MB
-
 Brent population pyramid.svg 2,743 × 2,163; 29 KB
-
 Bromley population pyramid.svg 2,743 × 2,168; 28 KB
-
 Buddhist population pyramid in 2021 in London.svg 3,189 × 2,586; 31 KB
-
 Camden population pyramid.svg 2,743 × 2,163; 28 KB
-
 Christian population pyramid in 2021 in London.svg 3,189 × 2,585; 33 KB
-
 City of London population pyramid.svg 2,743 × 2,163; 28 KB
-
 Comparison of the population of London metropolitan area and European countries.png 2,454 × 1,774; 537 KB
-
 Croydon population pyramid.svg 2,743 × 2,168; 29 KB
-
 Drug misuse rate in London.svg 2,250 × 1,494; 14 KB
-
 Ealing population pyramid.svg 2,743 × 2,163; 29 KB
-
 Employment in public or private sector in London.svg 2,242 × 1,756; 3 KB
-
 Employment rate in London.svg 2,442 × 1,715; 15 KB
-
 Enfield population pyramid.svg 2,743 × 2,163; 29 KB
-
 English as main language in London 2021.svg 512 × 411; 46 KB
-
 Ethnic makeup of London in single year age groups.svg 3,467 × 2,303; 50 KB
-
 Ethnic makeup of London over time in age groups.gif 1,200 × 792; 329 KB
-
 Fertility rate of each London borough in 2021.svg 512 × 411; 103 KB
-
 Filipinos in London.svg 512 × 410; 2.9 MB
-
 Foreign born and UK born percentage of age groups in London.gif 1,200 × 820; 364 KB
-
 Foreign born in London boroughs 2021.svg 512 × 411; 113 KB
-
 Foreign born in London by age over time.gif 1,200 × 836; 309 KB
-
 Foreign born in London in 1961.svg 512 × 411; 103 KB
-
 Foreign born in London in 1971.svg 512 × 411; 102 KB
-
 Foreign born in London in 1981.svg 512 × 411; 103 KB
-
 Foreign born in London in 1991.svg 512 × 411; 102 KB
-
 Foreign born in London in 2001.svg 512 × 411; 102 KB
-
 Foreign born in London in 2011.svg 512 × 411; 102 KB
-
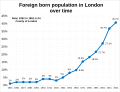 Foreign born in London over time.svg 2,186 × 1,668; 24 KB
-
 French in London.svg 512 × 410; 1.15 MB
-
 GDHI across London in 2020.svg 512 × 411; 102 KB
-
 Greenwich population pyramid.svg 2,743 × 2,163; 29 KB
-
 Hackney population pyramid.svg 2,743 × 2,163; 29 KB
-
 Hammersmith and Fulham population pyramid.svg 2,743 × 2,163; 28 KB
-
 Haringey population pyramid.svg 2,743 × 2,163; 29 KB
-
 Harrow population pyramid.svg 2,743 × 2,163; 26 KB
-
 Havering population pyramid.svg 2,743 × 2,163; 29 KB
-
 Hillingdon population pyramid.svg 2,743 × 2,163; 28 KB
-
 Hindu population pyramid in 2021 in London.svg 3,189 × 2,586; 32 KB
-
 Hounslow population pyramid.svg 2,743 × 2,163; 29 KB
-
 Islington population pyramid.svg 2,743 × 2,163; 29 KB
-
 Jewish population pyramid in 2021 in London.svg 3,189 × 2,586; 32 KB
-
 Kensington and Chelsea population pyramid.svg 2,743 × 2,163; 29 KB
-
 Kingston upon Thames population pyramid.svg 2,743 × 2,163; 29 KB
-
 Lambeth population pyramid.svg 2,743 × 2,163; 28 KB
-
 Lewisham population pyramid.svg 2,743 × 2,168; 29 KB
-
 London 1881 population pyramid.svg 2,811 × 2,167; 17 KB
-
 London 1981 population pyramid.svg 2,811 × 2,167; 17 KB
-
 London British only identity population pyramid in 2021.svg 2,623 × 2,081; 33 KB
-
 London English and British identity population pyramid in 2021.svg 2,623 × 2,081; 33 KB
-
 London English only identity population pyramid in 2021.svg 2,623 × 2,081; 33 KB
-
 London ethnic demographics from 1961 to 2021.gif 1,200 × 1,097; 516 KB
-
 London foreign born population pyramid in 2021.svg 2,623 × 2,081; 33 KB
-
 London Non-UK only identity population pyramid in 2021.svg 2,623 × 2,081; 33 KB
-
 London population pyramid 1931.svg 2,811 × 2,167; 18 KB
-
 London population pyramid 1951.svg 2,811 × 2,167; 18 KB
-
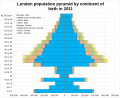 London population pyramid by continent of birth in 2011.svg 3,144 × 2,548; 28 KB
-
 London population pyramid from 2001 to 2020.gif 1,200 × 955; 641 KB
-
 London UK and non-UK identity population pyramid in 2021.svg 2,623 × 2,081; 33 KB
-
 London UK born population pyramid in 2021.svg 2,623 × 2,081; 32 KB
-
 Merton population pyramid.svg 2,743 × 2,163; 29 KB
-
 Mixed births in London 2021.svg 512 × 411; 46 KB
-
 Mixed ethnic group 2021 London.svg 512 × 411; 46 KB
-
 Muslim population pyramid in 2021 in London.svg 3,189 × 2,586; 32 KB
-
 National identity makeup of London by single year ages in 2021.svg 3,812 × 2,413; 50 KB
-
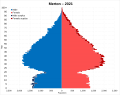
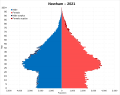 Newham population pyramid.svg 2,743 × 2,163; 29 KB
-
 No answer population pyramid in 2021 in London.svg 3,189 × 2,586; 33 KB
-
 No religion population pyramid in 2021 in London.svg 3,189 × 2,586; 33 KB
-
 Other ethnic group 2021 London.svg 512 × 411; 47 KB
-
 Other religion population pyramid in 2021 in London.svg 3,189 × 2,586; 32 KB
-
 Over 65s in London.svg 512 × 411; 102 KB
-
 Percentage of conceptions aborted in London.svg 512 × 411; 103 KB
-
 Percentage of Reception age children obese in 2020 in London.svg 512 × 411; 103 KB
-
 Percentage of Year 6s obese in 2020 in London.svg 512 × 411; 102 KB
-
 Poles in London.svg 512 × 410; 2.87 MB
-
 Population growth in London between 2011 to 2021.svg 512 × 411; 102 KB
-
 Population pyramid of London by ethnicity in 1991.svg 2,514 × 2,054; 37 KB
-
 Population pyramid of London by ethnicity in 2001.svg 2,670 × 1,985; 46 KB
-
 Population pyramid of London by religion in 2021.svg 3,245 × 2,578; 120 KB
-
 Private rent in London in 2021.png 4,282 × 3,281; 4.12 MB
-
 Punjabis in London.svg 512 × 410; 2.9 MB
-
 Redbridge population pyramid.svg 2,743 × 2,163; 29 KB
-
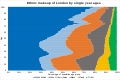
 Religious makeup of London in single year age groups.svg 2,984 × 2,108; 44 KB
-
 Richmond upon Thames population pyramid.svg 2,743 × 2,163; 29 KB
-
 Sikh population pyramid in 2021 in London.svg 3,189 × 2,586; 31 KB
-
 Social rent in London in 2021.png 4,439 × 3,284; 4.22 MB
-
 Southwark population pyramid.svg 2,743 × 2,163; 29 KB
-
 Sri Lankans in London by Ward.svg 512 × 410; 2.87 MB
-
 Sri Lankans in London.svg 512 × 410; 1.05 MB
-
 Sutton population pyramid.svg 2,743 × 2,163; 29 KB
-
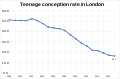 Teenage conception rate in London.svg 2,288 × 1,503; 14 KB
-
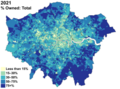 Tenure - Owned household in London in 2021.png 4,393 × 3,261; 3.99 MB
-
 Tower Hamlets Ethnic groups.png 340 × 296; 17 KB
-
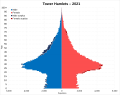 Tower Hamlets population pyramid.svg 2,743 × 2,168; 27 KB
-

-
 Turks in London.svg 512 × 410; 1.06 MB
-
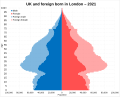 UK born and foreign born population pyramid in London in 2021.svg 2,582 × 2,078; 48 KB
-
 Under 15s in London.svg 512 × 411; 102 KB
-
 Unemployment rate in London.svg 2,159 × 1,445; 11 KB
-
 Waltham Forest population pyramid.svg 2,743 × 2,163; 29 KB
-
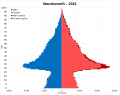 Wandsworth population pyramid.svg 2,743 × 2,163; 28 KB
-
 Westminster population pyramid.svg 2,743 × 2,163; 28 KB
-
 White births in London in 2021.svg 512 × 411; 46 KB
-
 White British births in London in 2021.svg 512 × 411; 46 KB
-
 White British school pupils percentage.svg 512 × 411; 46 KB
-
 White percentage 2021 London.svg 512 × 411; 103 KB
-
 White total school children in London.svg 512 × 411; 67 KB
-
 Year of arrival of foreign born residents within London.svg 1,996 × 1,723; 11 KB
_in_London.svg)


.jpg)


